Complaining about the performance of the referee goes hand in hand with sporting contests. It’s currently very topical in the rugby world, as in the weekend just past a controversial referring decision denied England a try against the All Blacks late in the game. This has many, especially some in the English media, claiming the referee cost England the game.
It seems like a good time then for us to answer the age old question, can a referee cost a team a win?
We’ve all heard people claim that the referee cost their team the game. We’ve probably all also heard the extra qualification that is sometimes added, that a referee can cost a team the game, but only if they lose by less points than the decision cost them.
An example of this type of thinking comes from the coach of the Australian national rugby team, Michael Cheika.
“We can only call it a turning point if we lose by less than one score, prehaps?” Michael Cheika
Cheika is referring to a decision that cost his team, the Wallabies, a try. The Wallabies then went on to be well beaten by more than a try in that game, and as a result Cheika feels he can’t call this a turning point. But if they had of lost by a try or less, he would presumably be comfortable with calling it a turning point.
Now I can’t be sure what Michael Cheika intended by a turning point, but in this post we need an objective definition of a turning point. We’ll assume that in a sporting contest a turning point is a significant shift in the probability of winning from one team to another (apologies if that’s not what you meant coach Cheika).
So let’s consider not only the question of whether or not a referee can cost a team a game, but also whether or not they can only cry foul if they lose by less than the decision cost them.
To answer these questions we don’t actually need to do any calculations or simulations. The question can be answered with a conceptual understanding of probability. However, we will use a simulation based approach as it will help guide us toward this understanding in a more visual way.
Note that we’ll be assuming that the refereeing decisions we discuss here were incorrect. Whether they were or not is a debate for another day. The simulation results presented will also be for matches between two evenly matched professional level teams. By extension we will also be assuming any real world games discussed below were between relatively evenly matched teams. This might be a stretch in some cases, but it doesn’t detract from the points we are trying to illustrate here. In the future we will look at simulations between teams with varying degrees of mismatching. Finally, we will restrict ourselves here to considering situations where we assume an incorrect referring decision almost immediately resulted in the scoring of points which we assume to be attributable to the decision.
With that said, let’s get to it.
The graph below was composed from 5000 Monte Carlo simulations of full rugby matches. It shows the probability of going on to win a game when trailing by 1 to 7 points from the 40th to the 76th minute of the match.
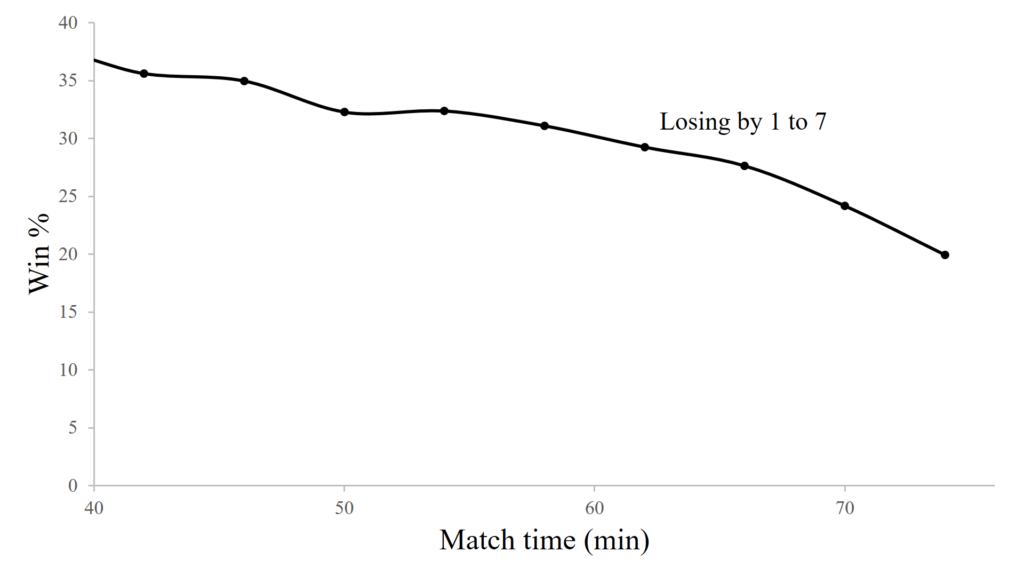
The graph shows that at the beginning of the half being behind by 1 to 7 drops a teams chances of winning the match to about 35%. From there the chances of winning decline as the match progresses. This decline becomes noticeably steeper as the final 15 minutes of the match are entered. This probability will tend to zero as the final whistle approaches. But in a one score game, it will never quite get there. There will always be hope as long as there is time on the clock.
Note, that if we did more simulations the trend in the graph would likely be smoother, and the values more precise. As it stands they should be considered to have a precision of about plus or minus 3%.
Now, from this position of losing by 1 to 7 points, let’s assume that a bad refereeing decision directly results in a try scored by our opponents under the posts, so that the conversion is assumed a formality. We go down by an additional 7 points, and now move to the category of losing by 8 to 14 points. The graph below shows this transition.
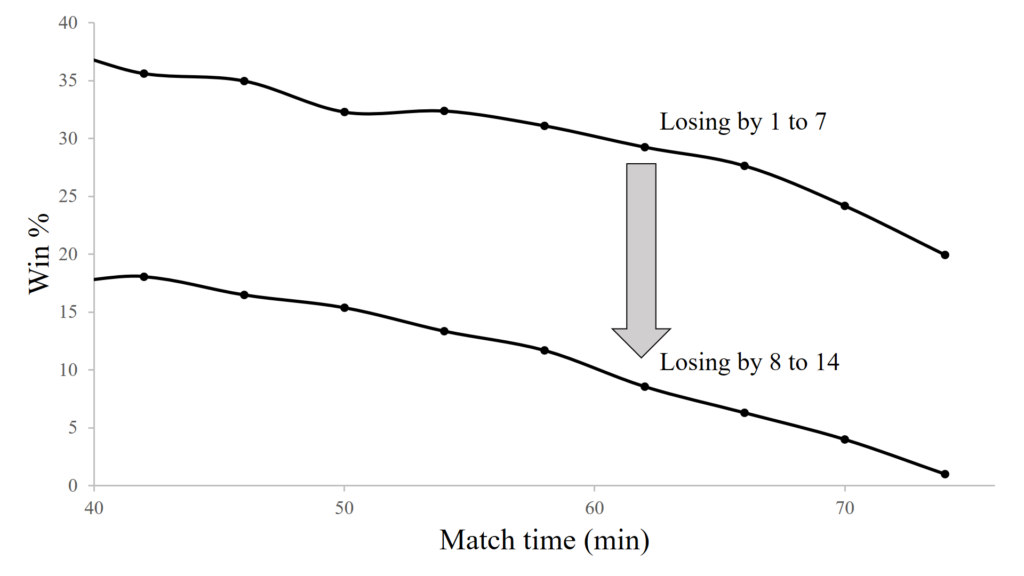
The trend in the graph remains similar, but it shifts down considerably, a clear turning point. In fact it shifts down by a fairly consistent margin of about 20% at all time values. So, a bad refereeing call which results in 7 points against us in the second half when we are already trailing by 1 to 7, reduces our chances of winning by about 20%. If this bad call occurs at the beginning of the half, our chances of winning drop to about 18%. But if it occurs around the 76th minute, they are reduced to around 1%.
Let’s go one final step further, by considering the impact of a bad call which transitions a team already losing by 8 to 14 to losing by 15 to 21. This is shown in the graph below.
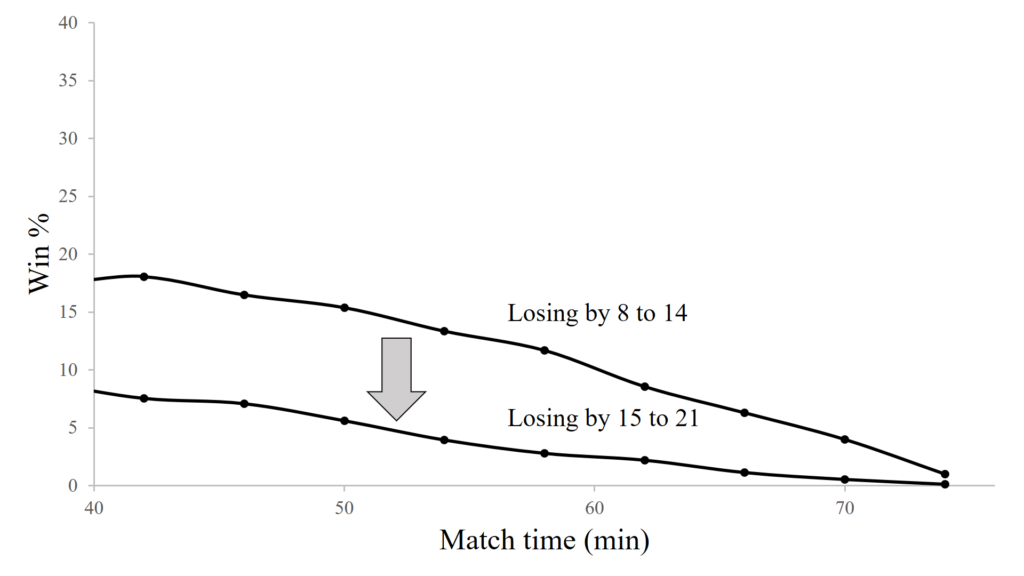
We see that the bad decision early in the half drops our chances of winning from about 18% to around 8%. Late in the half they drop from around 1% to pretty much 0%. A drop to 0% will occur whenever it is not practically possible for us to win the game in the time remaining.
This analysis allows us to make three important statements about the impact of poor refereeing decisions of the type we are considering, and in doing so answers our question of whether or not the referee can cost us the game.
1. Reducing the probability of winning – the most common result of a bad decision is to reduce the probability of winning, but still leave us with a chance to win the game.
2. Denying the opportunity to win – the reduction in the probability of winning can result in it becoming zero. This occurs when there is not sufficient time left in the match to score the points required to win. In this case the referee has denied us the opportunity to win. This is subtly different from costing us the game, since if the decision had not been made both teams would still have a chance to win and therefore we can’t be sure we would have won.
3. Costing the game – if a refereeing decision denies us the chance to put our opponent in a position in which their probability of winning would be reduced to zero, and they then go onto win the match, that decision will have categorically cost us a win.
So the referee can cost us the game.
What about the idea that a referee can only cost a team the game if they lose by less points than the decision cost their team?
Well, interestingly there is some truth to this.
Consider the situation where the criteria for costing a game is met as specified above. A team needs $latex x$ scores to give them the win, which will put them a single score ahead of their opposition. There isn’t time for $latex x + 1$ scores. So if the team who is $latex x$ scores ahead is denied an opportunity to go $latex x + 1$ scores ahead due to a poor refereeing decision, and their opponent then goes onto win, it can only be by scoring $latex x$ times, since that is all their is time for. They will win be one score (or less in a multipoint scoring system).
Notice I said there is some truth to this. That’s because there can be many situations where a refereeing decision will cost a team a given amount of points and they then go onto lose by less than that amount, but the criteria for costing the game will not be met. For example, we saw earlier that at the beginning of the half when we are trailing by 1 to 7 a bad decision which results in a try against us reduces our chances of winning to 18%. We still have a chance to win, so even if we go onto lose by less that the bad decision cost us, we can’t claim it cost us the game. So, while a team who has been cost the game will lose by less than the decision cost them, losing by less than a decision cost a team does not guarantee they were cost the game.
What about a turning point? Do we have to lose by less than the amount a bad call cost us in order to consider ourselves disadvantaged by the decision. In terms of a turning point, which we consider to be a swing in the probability of winning, the answer is obviously, no. We have seen a bad refereeing call can result in a large drop in the probability of winning, regardless of what happens next. The final score is irrelevant. Likewise, the referee can deny us the opportunity to win without the final score having any relevance.
In fact, in a sport like rugby, large turning points will be by far the most common way a poor refereeing decision will impact a team. Being denied the opportunity to win will be less common, and being cost the game even less common again. So when we fixate on decisions where a team may have been cost the game, or very nearly so, we miss out on identifying many other opportunities for refereeing improvement.
In my opinion, we should be focusing on turning points. They are much more common, and therefore provide many more opportunities for improvement. The situation is often made worse by the fact that teams disadvantaged by a turning point can still go onto win. Unfortunately, most teams don’t complain as loud, if at all, when they win. So a lot of opportunities to highlight and improve our refereeing slip under the radar. One of the advantages of quantifying the effect of bad calls in the way we have done here, is that they are less likely to be overlooked because we can put a value on their effect, regardless of the end result of the match.
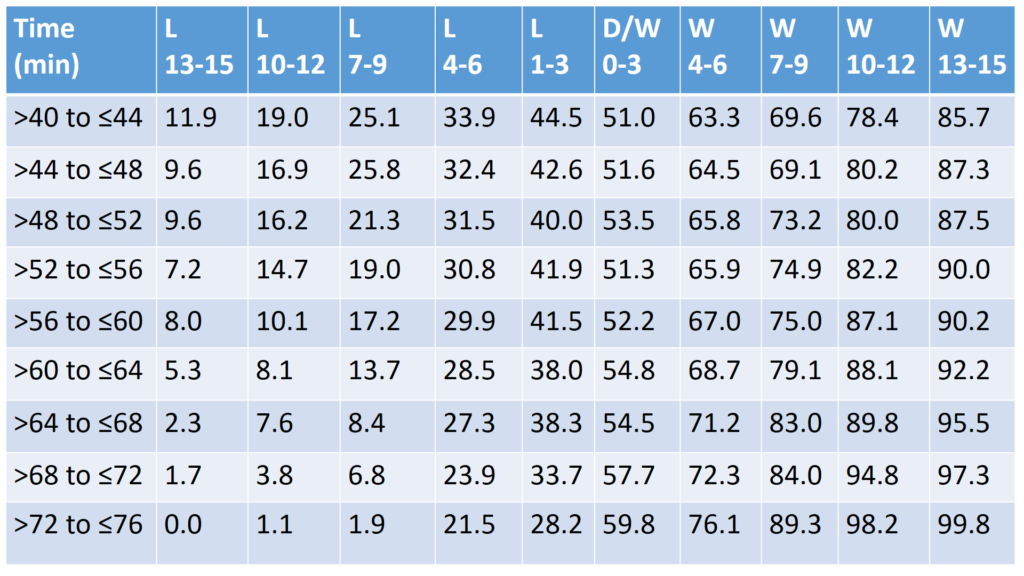
To highlight what we have discussed, let’s have some fun by looking at how much some famous real life controversial refereeing decisions impacted the teams involved. I have prepared a look up table below to assist us, and will look at a few well known games that I found interesting (I’m a New Zealander so forgive my bias selection of games involving the All Blacks). Feel free to apply the same process to any other games that interest you. Once again, treat the values as about plus or minus 3% precision (which explains why, for example, we see some small upward fluctuations when moving from one cell to the one below it).
Match 1 – New Zealand 37 Australia 10 – October 18 2016 Eden Park, Auckland.
This is the game Michael Cheika was referring to in the quote at the beginning of this article. With about 45 minutes on the game clock the Wallabies were trailing by 15 to 10 when Henry Speight scored a try which would subsequently be disallowed to the dismay of many.
Using the table above the Wallabies had a 32.4% chance of winning (Row >44 to <= 48, Column L 4-6), and were denied the opportunity to move to a 51.6% chance of winning (Row >44 to <= 48, Column D/W 0-3). In making his decision the referee reduced the Wallabies chances of winning by 19.2%.
The decision did not cost the game, and it did not deny the opportunity to win. It did result in a major turning point, which disadvantaged the Wallabies. By focusing on whether or not they lost by less than the decision cost them, coach Cheika and the Wallabies missed the opportunity to identify a crucial turning point. The failure to highlight this makes it less likely that an opportunity for refereeing improvement was identified and subsequent action taken (action is always more likely when people complain).
Match 2 – England 15 New Zealand 16 – November 10 2018, Twickenham.
At the time of writing, this game occurred in the weekend just past. With about 75 minutes on the game clock England were trailing by 15 to 16 when Sam Underhill scored a try which would subsequently be disallowed due to an offside infringement.
Using the table above England had a 28.2% chance of winning (Row >72 to <= 76, Column L 1-3), and were denied the opportunity to move to a 76.1% chance of winning (Row >72 to <= 76, Column W 4-6). In making his decision the referee reduced England’s chances of winning by q whopping 47.9%.
This decision is still being debated. Assuming it is incorrect, while it did not cost England the game, or deny them an opportunity to win, you can see it had a huge impact on England’s chances of winning. A very big turning point indeed.
Match 3 – France 20 New Zealand 18 – October 6 2007, Cardiff.
This game was a quarter final match in the 2007 Rugby World Cup. With just over 68 minutes on the game clock New Zealand were winning by 18 to 13 when France scored a try after a forward pass went unnoticed by the referee and his touch judges.
Using the table above New Zealand had a 72.3% chance of winning (Row >68 to <= 72, Column W 4-6), which was reduced to a 33.7% chance of winning (Row >68 to <= 72, Column L 1-3). New Zealand’s chances of winning were reduced by about 38.6%.
This game is still talked about on a regular basis in New Zealand. Just buy a New Zealander a beer, and ask him about this game. When he tells you that referee Wayne Barnes cost New Zealand the game, have some fun correcting him. Tell him New Zealand were not cost the game, or denied the opportunity to win. It was simply a turning point which reduced their chances of winning. In fact they still had about a 1 in 3 chance of winning. They just didn’t take it!
Let’s summarise.
A referee can cost a team a win. When this happens, that team will lose by a score or less. However, losing by a score or less even when a team was cost a score by a poor refereeing decision doesn’t guarantee they were cost the game.
In addition to being cost they game, a refereeing decision can also deny a team the opportunity to win. However, the most common result of a poor refereeing decision is to cause a turning point which shifts the probability of winning toward one team and away from the other. If we focus on and quantitatively understand turning points, as we have done here, we identify many more opportunities for the improvement of referee decisions in crucial situations. This in turn, provides us with more opportunities to improve the spectacle of the game for all involved.
Finally, note that although we have restricted ourselves to situations in which points were scored. We need not. In the future we could also readily determine what the effect of a incorrect decision such as a knock on call has on the probability of a team winning at various stages of the game and various locations on the field. We can also look at player decisions. For example should a player take a tackle or chip ahead in a certain situation? Should we kick for touch or take a shot at goal in a certain situation? In other words, which option will maximise our chances of winning?