
We all know size matters in rugby. In fact it’s a big part of what makes the sport such a spectacle. There’s something primal about high speed collisions.
But how much does size matter? How important is it to winning a rugby game?
With the next Rugby World Cup rapidly approaching, we’ll try and answer this question by taking a look back to the very first Rugby World Cup which took place in New Zealand in 1987.
The world has changed a lot since 1987, and the size of rugby players is no exception. To see how this has affected the game, we will take the world cup winning All Black teams from both 1987 and 2015 and play them against each other in 2000 Monte Carlo simulations. For those looking for an explanation of how such simulations work, refer back to the first post.
Because we are interested only in the effects of size (height and weight), we’ll give all the players equal skills (e.g. handling and tackling) and physical abilities (e.g. speed and acceleration), but allow their height and weight to be set to their actual values. For simplicity, their equal skills and physical abilities will be set at the level of a typical modern day rugby player in each position, since we already have reasonable input data for this.
The table below presents the starting lineups, including a comparison of the heights and weights of the 1987 and 2015 All Black sides. The bracketed values give the relative increase or decrease of the 2015 side over the 1987 side.
Comparison of the heights and weights of the starting lineups of the 1987 and 2015 Rugby World Cup winning teams.| 1987 | Height (cm) | Weight (kg) | 2015 | Height (cm) | Weight (kg) |
|
|---|---|---|---|---|---|---|
| 1 | Steve McDowall | 182 | 102 | Joe Moody | 188 (+6) | 120 (+18) |
| 2 | Sean Fitzpatrick | 183 | 105 | Dane Coles | 184 (+1) | 108 (+3) |
| 3 | John Drake | 183 | 99 | Owen Franks | 185 (+2) | 118 (+19) |
| 4 | Murray Pierce | 198 | 107 | Brodie Retallick | 204 (+6) | 121 (+14) |
| 5 | Gary Whetton | 198 | 105 | Sam Whitelock | 203 (+5) | 120 (+15) |
| 6 | Alan Whetton | 193 | 100 | Jerome Kaino | 195 (+2) | 109 (+9) |
| 7 | Michael Jones | 185 | 98 | Richie McCaw | 187 (+2) | 107 (+9) |
| 8 | Wayne Shelford | 189 | 107 | Kieran Read | 193 (+4) | 111 (+4) |
| 9 | David Kirk | 173 | 73 | Aaron Smith | 169 (-4) | 83 (+10) |
| 10 | Grant Fox | 175 | 72 | Dan Carter | 180 (+5) | 92 (+20) |
| 11 | Craig Green | 178 | 79 | Julian Savea | 192 (+14) | 103 (+24) |
| 12 | Warwick Taylor | 179 | 79 | Ma'a Nonu | 182 (+3) | 108 (+29) |
| 13 | Joe Stanley | 178 | 83 | Conrad Smith | 187 (+9) | 95 (+12) |
| 14 | John Kirwan | 191 | 100 | Nehe Milner-Skudder | 180 (-11) | 90 (-10) |
| 15 | John Gallagher | 190 | 85 | Ben Smith | 186 (-4) | 94 (+9) |
On average the 2015 All Blacks are taller than their 1987 counterparts by a fairly modest 3 cm. All but three players in the 2015 side are taller than the player in the same position on the 1987 side. The biggest difference between the same position is in the left wing spot where 2015’s Julian Savea is 14 cm taller than 1987’s Craig Green.
The differences in weight are more striking.
On average the 2015 All Blacks are heavier by 12 kg. All but one player in the 2015 side is heavier than the player in the same position on the 1987 side. The biggest difference between the same position is at inside centre where 2015’s Ma’a Nonu is a whopping 29 kg heavier then 1987’s Warwick Taylor. In the fly-half position, two All Black greats square off in 2015’s Dan Carter and 1987’s Grant Fox. Carter is not considered exceptionally big in the modern game, but still weighs in 20 kg heavier than Fox.
It’s not all bad news for 1987. One player is taller and heavier than his 2015 version. All Black legend John Kirwan is 11 cm taller and 10 kg heavier than 2015’s Nehe Milner-Skudder in the right wing position. Perhaps this is part of the reason why Kirwan was so good in his era?
So, let’s run our 2000 match simulations and see how much of the size advantage of the 2015 team translates into winning advantage. The chart below presents the results.
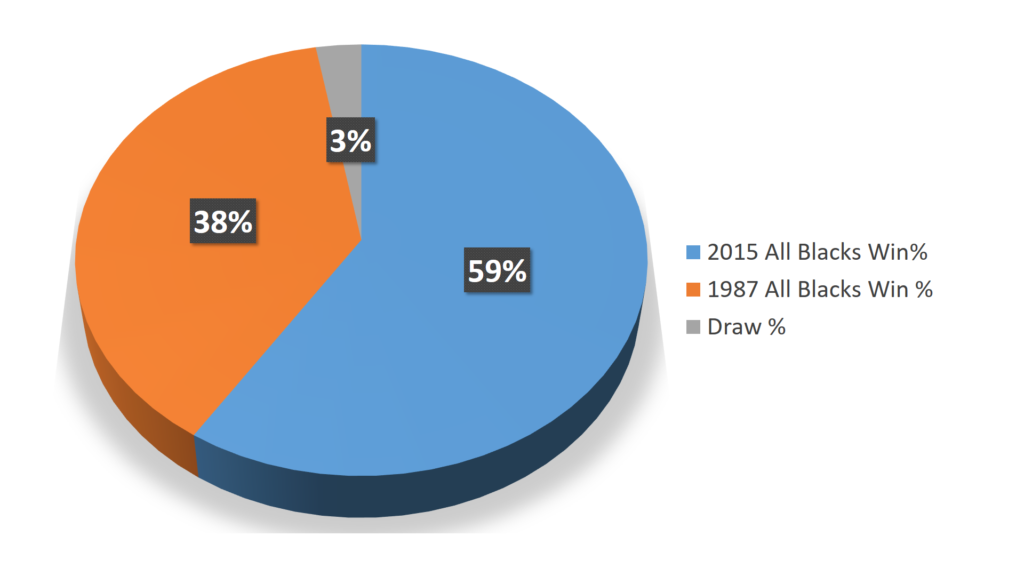
The results show that the 2015 All Blacks win 59% of the games, 38% are won by the 1987 All Blacks, with the remaining 3% ending in draws. Two perfectly evenly matched sides will each win around 48.5% of matches, so through increased size alone the 2015 All Blacks have increased their chances of winning over 1987 side by about 10%.
So what causes this advantage? Is it the increased height, increased weight, or a combination of the two?
To answer this question we will return to running some simulations with input consistent with two evenly matched professional rugby sides. The same input used in previous posts. When doing this but allowing one team to be 10 cm taller than the other in every position and running 2000 match simulations, no significant difference in winning percentage was observed. This tells us that a typical professional rugby team is already sufficiently tall, and that height for heights sake is not of much further use to them.
Why might this be? Well, most of the aerial contests in rugby in general play involve the ball coming down from a relatively steep angle. They are contested by jumping, and it is a players ability to jump high rather than be tall that is important in these contests. Tall players might be more useful in the lineout, but it would appear that a 200 cm lock is already sufficiently tall, being 210 cm tall does not appear to improve the teams chances of winning. At least not in a statistically significant way over 2000 matches.
Assuming no significant interaction between height and mass, it must be that the improvement in winning is a result of increased mass only. In this regard we note that height is still a useful attribute to a rugby team, as a large frame likely comes with more mass. We also note that mass is not important to a rugby team in and of itself. It’s when is combines with velocity to create momentum that it becomes, well, hard to stop (excuse the physics pun).
The graph below gives us a closer look at the effects of increased mass by comparing our two evenly matched rugby sides whilst allowing one of them to progressively increase the weight of every player on the team, whilst holding all of their other attributes constant. Each data point represents 2000 match simulations.
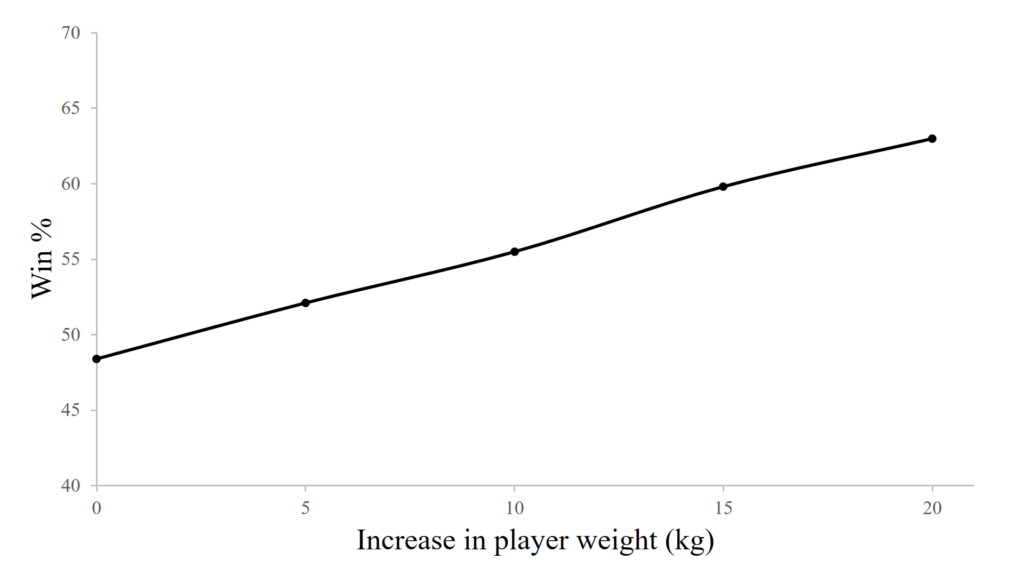
The results show that the winning percentage increases from around 48.5% to 63% over a 20 kg range. The line is in fact highly linear ($latex R^2=0.999$), with a slope of 0.74 win percent per kg. This means that, all other things being equal, our typical professional rugby team will gain about 3/4 of a percent in winning probability for each kg in weight they gain over the range we have tested. Another way of stating this is for every 1.4 kg they gain they will increase their probability of winning by 1%. The key here is that this weight must be gained in such a way that all other things remain constant. For example, they must not lose speed, fitness or have the quality of their skill execution decline. Achieving mass gain without any such reductions will require skill on the part of the strength, conditioning, and coaching staff.
In any case, we have made an important step in this post by moving from knowing intuitively that size is important to performance in rugby, to being able to quantify its value. We have also importantly been able to prioritise mass as being more important than height. Among other explorations, we’ll continue to progress toward the goal of determining not just what is important, but how important it is. For example, we know mass is important, but is it more important the speed or handling? The answer will of course be different for different teams depending on their relative strengths and future potential, but whatever the case, determining relative importance of any parameter that is related to performance will ultimately allow us to prioritise our training efforts and maximise our chances of winning. After all, that’s what it’s all about.
If you enjoyed this post, don’t forget to subscribe by entering your email above. Feel free to share this article too.