It has been a while since my last post which dealt with Game Probability Profiles (GPP’s). Part of the reason for this is that I found the concept of the GPP to be so useful in analysing matches that I’ve been spending some time developing an application which allows for easy production of the GPP of a match in realtime. As part of this I have also added the ability to easily calculate the profiles for mismatched teams, as well as some other useful information.
To demonstrate, I will go over some key aspects of the previous weekends clash in Super Rugby between the Crusaders and the Blues.
You may recall, that in the previous GPP post we looked at a match between Ireland and New Zealand, and we assumed that on that day they were evenly matched. Although this is clearly not the case for the Crusaders and the Blues, with the Crusaders being a far superior side, let’s have a look first at what the GPP would look like if they were evenly matched.
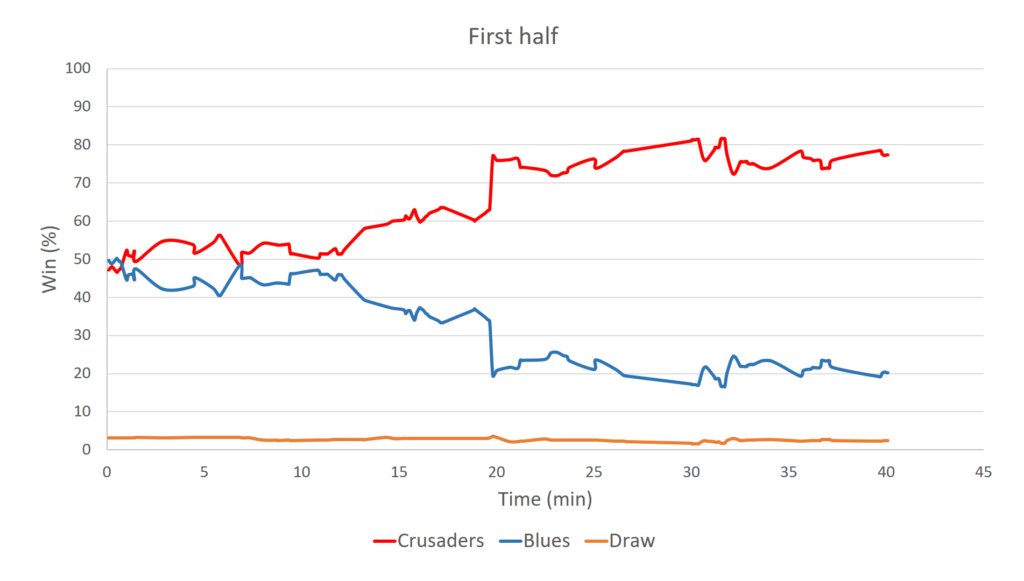
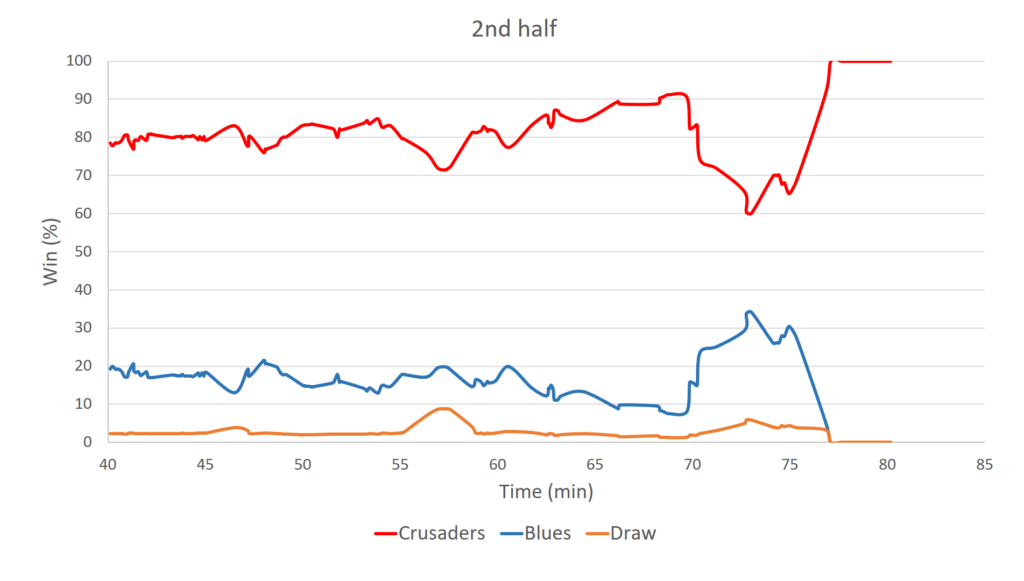
You can see that even when we assume the sides are evenly matched the GPP paints a bleak picture for the Blues. The Crusaders quickly manipulate the match into a situation where after 20 minutes they have around an 80% chance of winning. They then hold this position for most of the match, with the Blues making a late charge at the end, which on this occasion turns out to be in vain.
The winning minutes, which are a reflection of the time each team spent in a position to win the match reflect the Crusaders dominance. These were 59 winning minutes to the Crusaders, 19 to the Blues and 2 to the draw.
Time to introduce a new, very valuable statistic, scoreless winning minutes. Scoreless winning minutes are simply the winning minutes of a game calculated with all the scoring plays removed. They therefore give an indication of the tactical dominance of each side, especially when calculated under the assumption of equal winning probability. They are useful because on a given day a team might play well and put itself in good positions to score points, but not convert those opportunities. This will be reflected in scoreless winning minutes and provides the team and coach an opportunity to assess their ability to put themselves in scoring positions and deny their opponent opportunities to score, regardless of whether they managed to execute on the day. In this game under the assumption of equal winning probability the Crusaders had 39 scoreless winning minutes, the Blues 36 and 5 went to the draw. So, the Crusaders were tactically superior, and this is perhaps one of the reasons for their success. The magnitude of difference in scoreless winning minutes between the side is not particularly large, being only 3. However, the matches I have analysed to date would suggest that even a small difference like this is a good indication of tactical dominance. As I analyse more matches it will become clearer what a typical difference is and how this relates to the degree of tactical dominance.
One other interesting statistic that can be easily calculated as part of the GPP calculations is the probability that the losing side would lose by this amount or more if it were of equal quality to its opponent. For this particular game the probability the Blues would lose by the amount they did or more if they were the equal of the Crusaders is 33.8%. This goes to show that when playing an evenly matched team you can expect to lose, and sometimes by substantial margins. So, unless you have good reason to believe you are inferior, their might be no need to panic.
Of course, in the case of the Blues we have good reason to believe they are an inferior side compared to the Crusaders. The evidence for this comes from a comparison of their performances to date so far this season. Most notably the Crusaders have scored an average of 32.1 points per game compared to the Blues 21.8, and have conceded only 17.2 points per game compared with the Blues 22.5. And although I won’t go into the details here, it is by utilizing this information that we can calculate the actual GPP for this match which takes into account the mismatching of the sides. This is presented below.
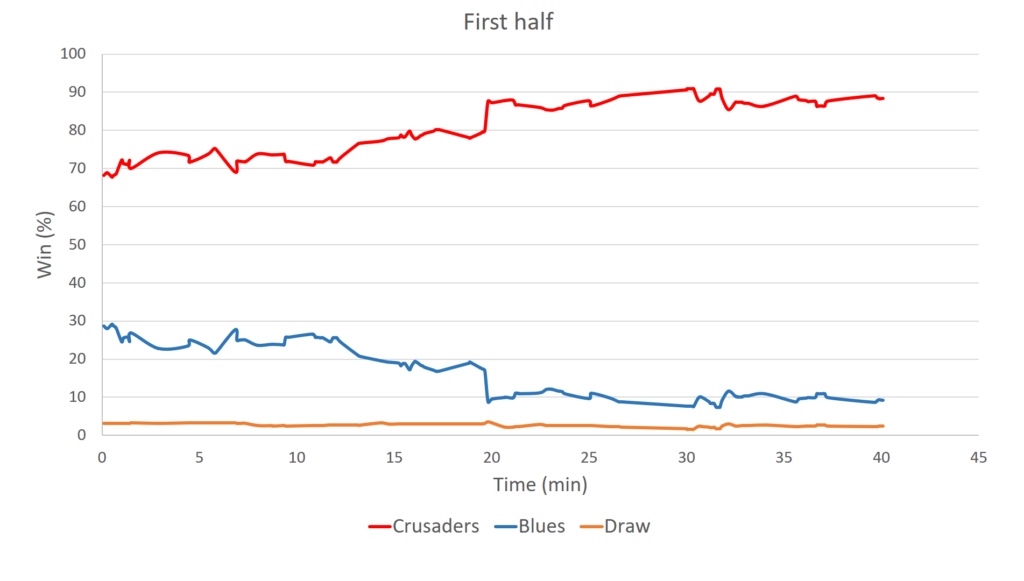
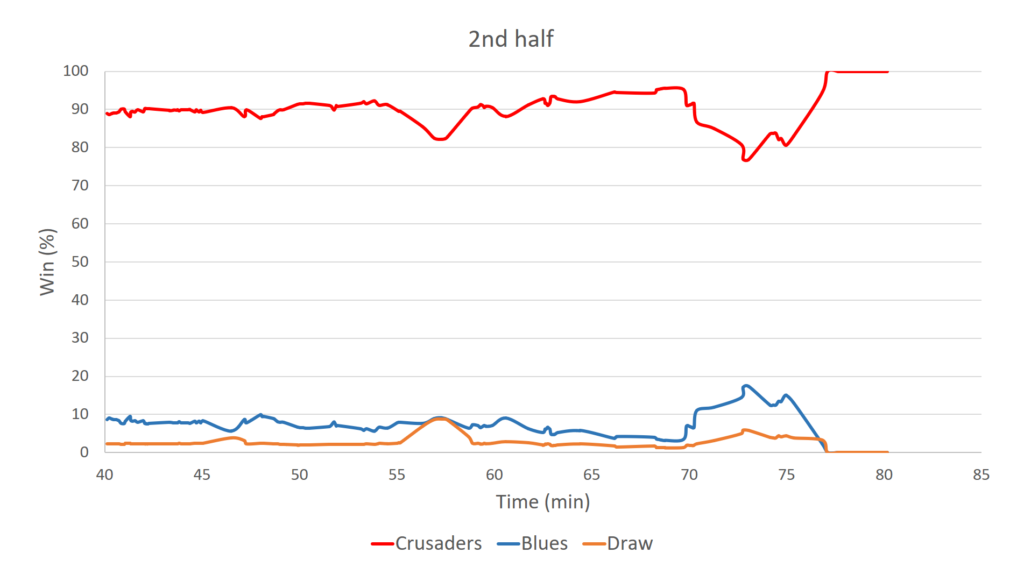
We see that things look even worse for the Blues. They start out the game with less than a 30% chance of winning. This is quickly whittled down to around 10% where it remains for most of the game, except for a brief spike at the end. The winning minutes are 69 to the Crusaders, 9 to the Blues and 2 to the draw.
So, are the Blues without hope when they come up against the Crusaders?
Well, yes and no. It is true that in order to win more often they will likely need better players and tactics, such that their attack and defense are better from the outset. Doing this will minimise the winning probability deficit between them and the Crusaders from the get go.
But obviously for now they are somewhat stuck with what they have. So accepting this, there is still much they can learn from the GPP and improve their chances after the game kicks off. Let’s have a look at a couple of examples.
In the graph below we have zoomed in on the GPP from minute 16 to 17 and are displaying the Blues probability of winning the game.
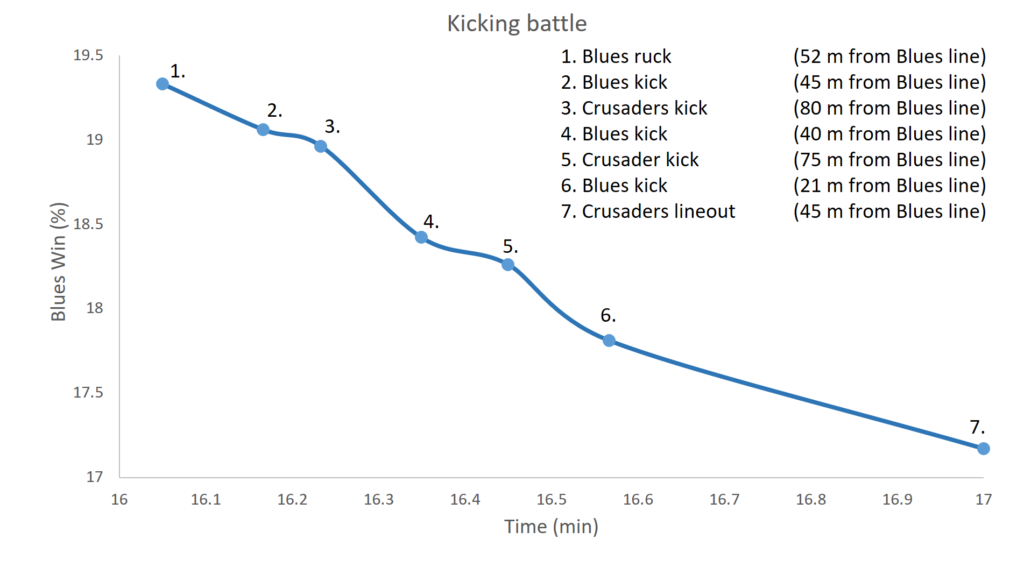
The graph shows the Blues start out with the ball at a ruck just over halfway. They then choose to engage in a territorial kicking battle with the Crusaders. With every action in this kicking battle, the Blues end up in a worse position. The end result is ultimately that they started with the ball 52 m from their own line and end up handing it over to the Crusaders 55 m out from their line (45 m from the Blues line). In the process they reduced their chances of the winning by over 2%.
Now, for us looking at the GPP it is clear and obvious that this was poor tactical play. It obviously wasn’t clear to the Blues, since they initiated this play and continued to engage in it. This demonstrates that through careful study of the GPP the Blues would be able to improve their chances to win and become better equipped to avoid situations like this. This also serves to illustrate that it is not always single large turning points that swing a match, but often the culmination of many smaller decisions can also be crucial to the outcome.
Having said that, let’s have a look at single event which has a large impact and identifies additional improvement opportunities for the Blues. The GPP segment below highlights one of the final sequences of the match. Only a few minutes remain and the Crusaders are attacking the Blues line with a lineout 20 m out. Despite this, the Blues still have a small chance of winning, around 13%. This might seem pathetic, but those who watched the match will know that the Blues fought hard as a team for this glimmer of hope. It’s around a 1 in 7 chance of winning from here, and it is better than nothing.
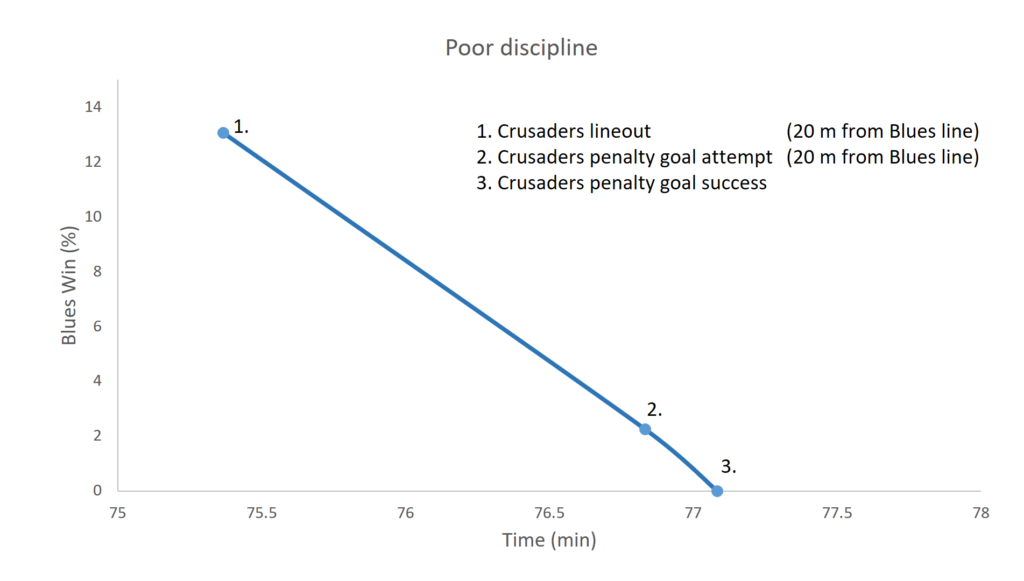
Unfortunately, at the lineout one of the Blues players gives away a needless penalty by pushing his opponent before the ball is in play. The Crusaders opt to line up a shot at goal which reduces the Blues chances to win to around 2%, and when the kick goes over their chances have reduced to 0% since there simply is no longer time left in the match for them to make up the deficit.
This is another example of something the Blues chose to do that was completely in their control. The player who gave away the penalty might have been frustrated or he may have even thought he was helping his team. I believe that if players could see the quantifiable impact of giving away needless penalties on winning percentage, then they would be less likely to give them away. The result would be improvements in their winning percentages, and obviously more wins would follow in the long term.
This might seem a little trivial to some. However, the GPP calculations allow us to easily rank all the turning points (winning probability swings in a match) and see what has the biggest impact. Doing this it becomes apparent that small things matter. It might surprise you to know that giving away the penalty discussed above was the single biggest reduction in the Blues winning percentage, causing a bigger reduction than the try they conceded which was the second biggest reduction from the Blues perspective. Third, was a simple handling error at a ruck in the 74th minute.
Small things matter. The Crusaders know it. Teams like the Blues need to learn it too. That’s what it takes to compete with the big boys.
There are of course many other improvements the Blues could make (as could the Crusaders) through careful analysis of the GPP calculations. In the next post we’ll examine something else the numbers tell us the Blues should be doing when they come up against superior sides like the Crusaders.
