
In the previous post we saw how Monte Carlo simulation can be applied to determine the impact of refereeing decisions on a team’s chances of winning.
This approach need not be restricted to refereeing decisions. It can be applied to any and all events that occur during the course of a contest. When this is done we end up with a Game Probability Profile (GPP), which paints a complete picture of the ebbs and flows of the chances of a team winning over the entire course of the contest.
It’s an extremely powerful tool which is useful for fans, coaches, analysts, and of course, in a gambling context. Basically anyone with a vested interest in a sport can derive great utility from a GPP. In this post we will focus on its use as a coaching and match analysis tool.
At a high level a GPP is useful to provide a complete, concise and elegant description of a game. At lower levels, its respectful study reveals the key turning points in a match and can be used to determine the strategies which contributed to the winning or losing of the match. In this article we will explore these various levels of a GPP by examining the profile of the recent Irish defeat of the All Blacks in Dublin.
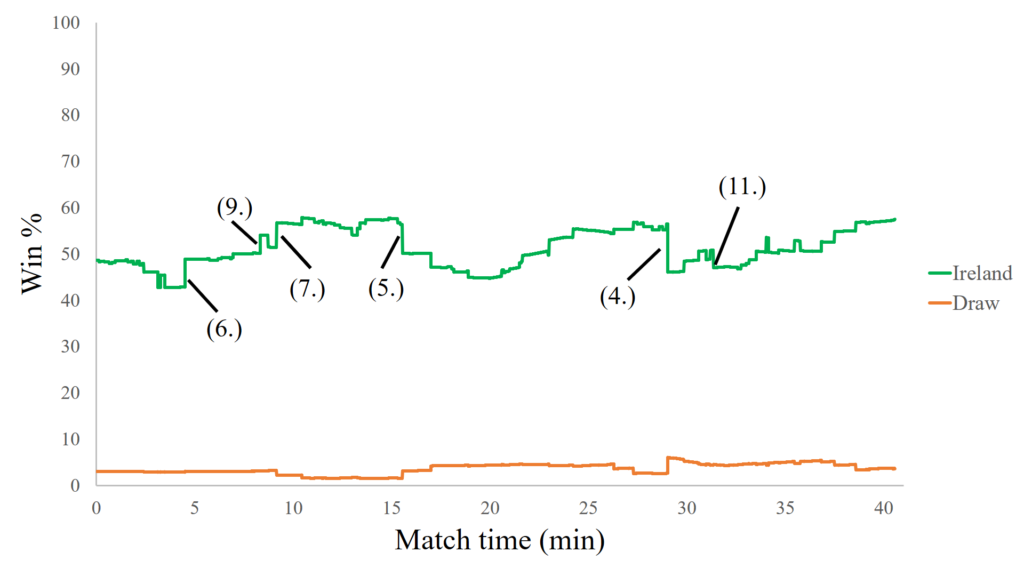
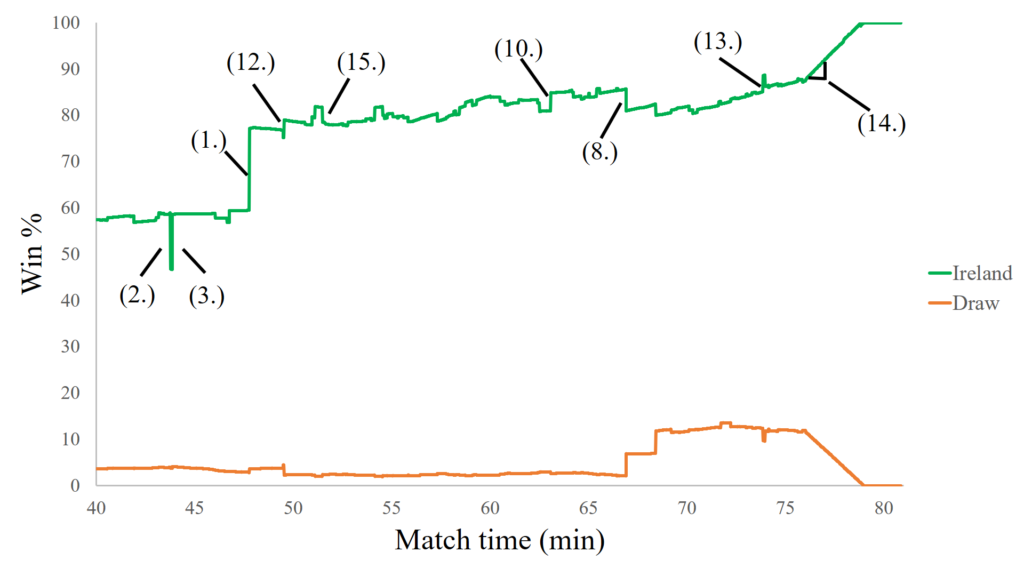
The figures below show the GPP from an Irish perspective for the first and second halves of the match. To illustrate the descriptive nature of a GPP some key features have been highlighted. Note that we are assuming the teams were evenly matched to begin with. Probably a reasonable assumption in this case, but we can just as easily apply the same approach to mismatched teams in the future.
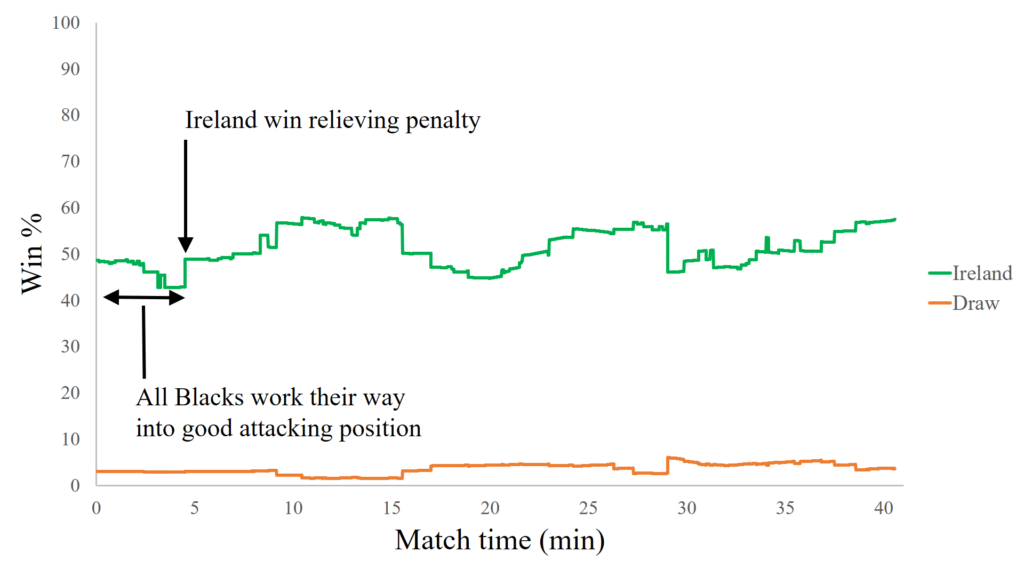
The GPP shows the All Blacks started the match well, as indicated by the decline in Ireland’s winning probability during the opening 4 minutes. They controlled territory and possession and worked their way into a position in which they had attacking rucks near Ireland’s goal line. This pressure was relieved by the spike in winning probability mid-way through the 4th minute when Ireland won a penalty at the ruck. The remainder of the first half results in various back and forth flows in winning probability, which we will discuss further when we consider turning points below. For now we will have a look at the illustrative features highlighted in the second half GPP above.
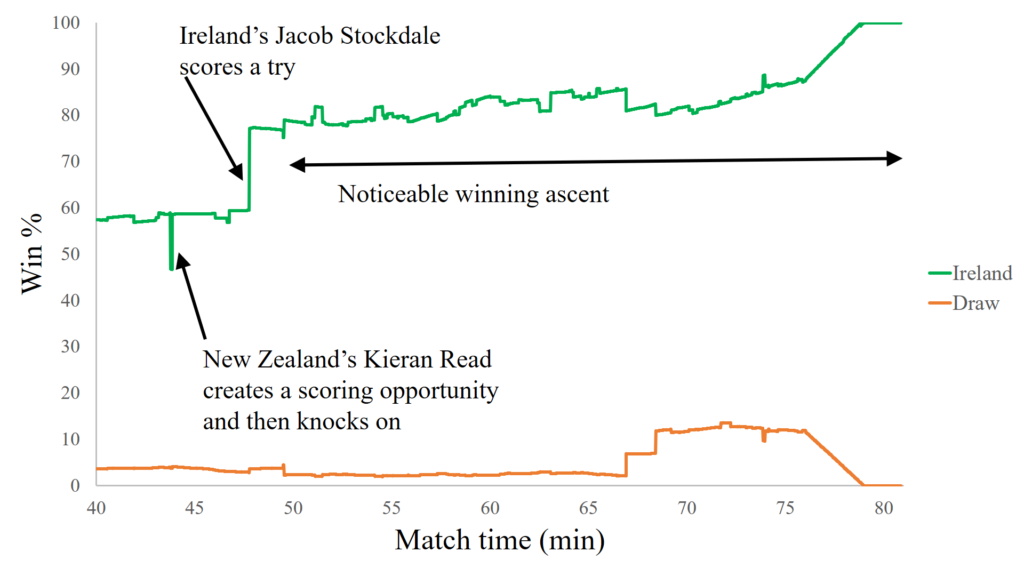
Firstly, there is the large down and up spike in winning probability around 43:45. This is when New Zealand’s Kieran Read charges down a kick from Ireland’s Jacob Stockdale to create a high probability scoring opportunity, but subsequently produces a handling error which took that opportunity away. A few minutes later the biggest turning point in the match occurs when Stockdale kicks and regathers to score what would be the only try of the match. This triggers an important phenomenon, the beginning of an increasingly rapid winning ascent (or losing descent). A winning ascent occurs as the result of a side being ahead and time running out on the clock. The more a team is ahead and the less time there is remaining, the steeper the ascent. It can serve as an important trigger for the losing side to know when to switch to increasingly higher risk-reward strategies. The fact that a GPP can be calculated in real-time means that this is one useful way a coach can utilise this tool during the match (we’ll see other examples of this below where the GPP would have been useful to assist in real-time decisions like whether or not to take a shot at goal). In this particular match, the noticeable winning ascent which begins after the Irish try is scored is briefly reduced by New Zealand around the 65th minute when they kick a penalty goal, before its steepness increases around the 75th minute as the clock runs toward full time.
Before looking at some of the finer details of a GPP, we will complete our high level overview by introducing the concept of winning minutes. Winning minutes are the area under the GPP. They tell us, out of the total time in the match, how much was dominated by each team in terms of the opportunity to win. The figure below displays the winning minutes for each team for both halves of the game, as well as for the entire match.
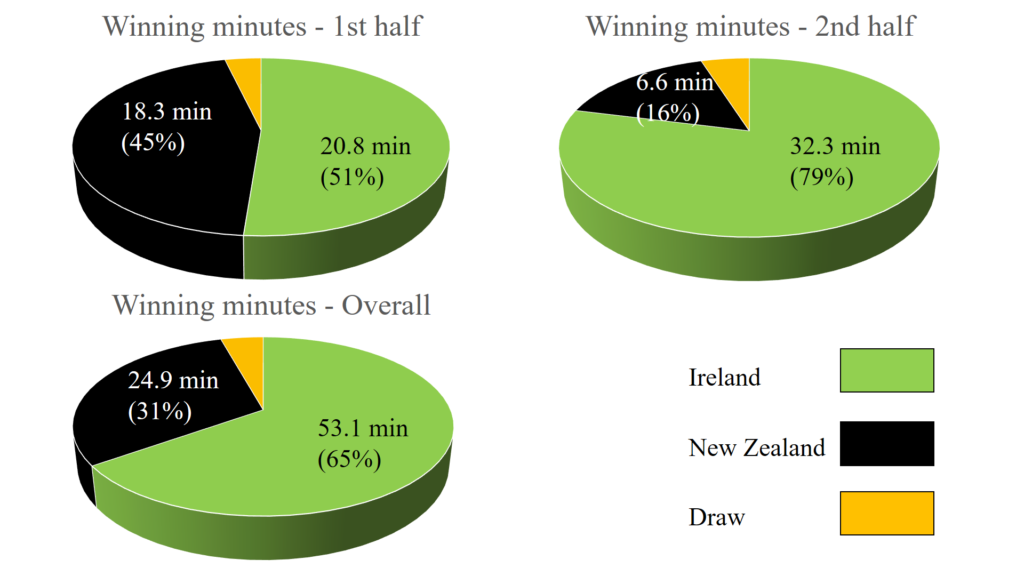
Overall, Ireland dominated the winning minutes with 53.1 minutes (65%) to New Zealand’s 24.9 minutes (31%), with the remaining minutes going to the draw. The first half winning minutes were closer with Ireland having 20.8 minutes (51%) to New Zealand’s 18.3 minutes (45%), but in the second half Ireland almost completely shut New Zealand down by collecting 32.3 winning minutes (79%) to New Zealand’s 6.6 minutes (16%).
Why is this important?
Winning minutes are very useful, because in a single descriptive statistic they tell us which team created the most opportunity to win the match. This can be very important, since it removes us from focusing on the score (or other statistics which might lead us astray). The team that consistently dominates winning minutes will win more matches. So by focusing on winning minutes we are more easily able to determine when we played well, even if we went on to lose. Likewise, we can more easily tell when we played poorly, even if we went on to win (notwithstanding the usual caveats with regard to sample size).
Perhaps we are testing a new strategy and have lost a few games. It would be easy to abandon this strategy. But if it has led to a relative increase in winning minutes we might think twice before throwing the baby out with the bath water. Conversely, we could win a few matches with our new strategy but experience a relative decrease in winning minutes. Perhaps we have just been lucky, and it might be best to abandon the strategy.
Whatever the case, the key point is that if a team consistently dominates winning minutes, the scoreboard will take care of itself in the long run.
With an understanding of winning minutes, let’s now move down a level and consider how the finer detail of the GPP can tell us not only who created the most winning opportunities, but how they were created. With that in mind, let’s take a look at the largest 15 turning points in the match. In the last post we considered a turning point to be any event which causes a significant swing in the probability of a team winning a match. We will look at the turning points from Ireland’s perspective. So, a positive turning point value represents an increase in their probability of winning, and a negative one a decrease.
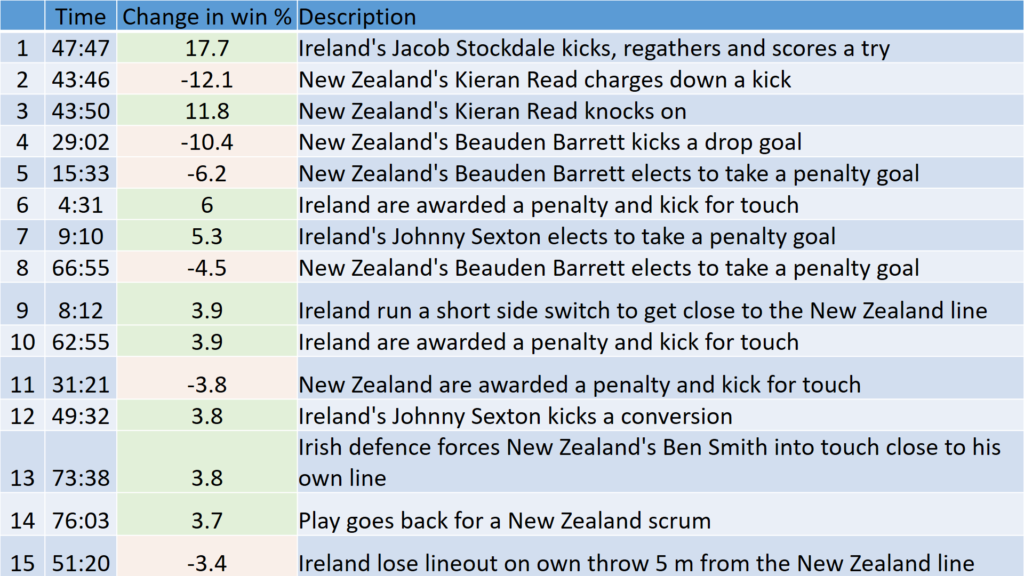
The largest turning point was the try scored by Ireland’s Jacob Stockdale, followed by Kieran Read’s charge down, and subsequent knock on. These are probably in agreement with the intuition of anyone who watched the match. They felt like important moments.
Of the remaining turning points on the list, only two are actually acts of scoring points. These are the Barrett drop goal and the Sexton conversion. The shot’s at penalty goal do not appear, but rather the decision to take them is the larger turning point. This is because the penalty shots carried a probability of success greater than 50%, and hence there is more value in electing to take them than when they actually go through the posts (if they go through the posts). The reverse is true of the drop goal and conversion taken in this match which were considered to have less than 50% chance of going over (the conversion was close to the sideline).
The remaining items on the list feature, among other events, relieving penalties when defending one’s own goal line, and losing one’s own lineout throw when in good attacking position. It’s also fascinating that a GPP picks up items like the effectiveness of Ireland’s blind side switch play (item no. 9) in penetrating the New Zealand defense and leading to good attacking opportunity.
It is very important to note that while we are looking at the largest turning points for illustrative purposes, this does not mean they are necessarily the most important. The cumulative sum of many smaller turning points can also lead to the creation of substantial opportunity (winning minutes) during the course of a match. This is something we will explore further in a future post.
One other really interesting item on the list is at 76:03 (no. 14), when play goes back for a New Zealand scrum resulting in an increase in Ireland’s winning percentage of 3.7%. This doesn’t register as a spike, but is the result of the time wasted setting a scrum while Ireland are in a steep winning ascent and New Zealand in a steep losing descent. What happens here is that the referee starts playing a knock on advantage to New Zealand and they use it as an opportunity to try an attacking kick, knowing that if it doesn’t come off they will still retain possession through a scrum. Players often use this tactic. The GPP shows that when you are in the middle of a losing decent, it may not be a good idea to use this tactic.
To know for sure whether it was a good idea to choose to attempt any particular action during a match, we need to compare its possible outcomes with the outcomes of alternative actions weighted by their relative probabilities of success. This directs us to the final level of GPP analysis we will consider in this post. Namely, a ‘What-If’ analysis. As the name implies, this involves taking an event in the match and changing it to something different to see what the impact on winning probability is.
To illustrate this we’ll have a look at the decision in the match where New Zealand elected to kick a goal at 66:55. What if they had instead opted to kick for touch and take a lineout 10 m out or less from the Irish goal line? The figure below answers this question.
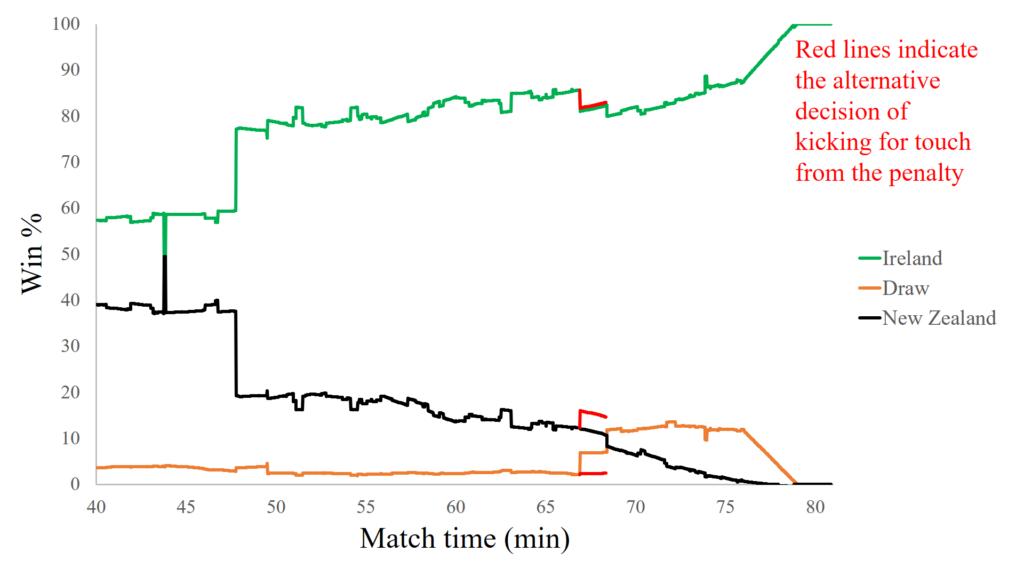
The red lines in the figure represent the change that would have occurred to the win and draw percentages if New Zealand elected to kick for touch, with the remainder of the figure simply being a replication of what actually happened in the match, as per the other GPP’s presented above. The result shows that the decision has about the same impact either way on Ireland’s chances of winning. The decision to kick a goal, increases New Zealand’s chances of a draw by about 5% but has virtually no impact on their chances of winning. This is because it still leaves them requiring two scores to win. On the other hand, had they kicked for touch, their chance of a draw remains almost unchanged, but their chance of winning increases by 4%. In this particular case, in terms of winning the game it is more valuable to have a relatively small chance of scoring a try than a good chance of scoring a penalty goal. So, if the All Blacks were trying to win the game, they made the wrong decision. If they were trying to draw it, they made the correct decision.
This is contrary to some conventional opinions which suggests it is always better to take the shot at goal. Indeed it’s a simple mathematical exercise which I’ll go over in another post to show that in many cases this is true. However, this standard approach often only considers the quality of the kicker in the calculation. In doing so, it neglects the fact that the current score, time remaining in the match, location of the kick at goal, and relative mismatching of the teams are important considerations in this calculation too. The GPP incorporates all of these factors and therefore comes out with the correct decision where the conventional simple calculation would produce an incorrect decision.
One final thing to note on the figure above is the downward slope on the red line of New Zealand’s winning percentage after they hypothetically elect to take the lineout. This indicates that not only should New Zealand take the lineout if they want to win, but they should take it as quickly as possible. Ireland on the other hand should take as much time as possible forming the lineout, as indicated by their upward sloping red line. In this regard the GPP can not only help us to make the correct decision, but serve as a reminder to the pace of play we should adopt once it becomes an important factor.
We need not restrict ourselves to examining decisions around shot’s at goal. We have already seen above that New Zealand’s decision to try an attacking kick in general play when they had a knock on advantage may have been questionable. What about other events? For example, should a team have kicked or kept the ball in hand in a other situations? If they should kick, what location should they kick too? Indeed, we can look at all events in the game when performing a What-If analysis. Doing this actually reveals the general strategy that Ireland uses to gain advantage by maximising opportunities (winning minutes). It’s interesting enough that we’ll leave this analysis for another post.
For now we’ve made good progress in introducing the GPP and seeing that it is an extremely valuable tool for enabling us to focus on what is important to our chances of winning. It’s fascinating that in some cases it confirms our intuition and in others challenges it, revealing new knowledge in the process. It can form an important loop of assisting real-time match decisions, post-match analysis, and subsequent design of strategies for upcoming matches. The bottom line is that teams who exploit the information contained in a GPP will win more games. In future posts we’ll look to delve deeper into this interesting area.