
Bounce of the ball. Rub of the green. Chance. Whatever you want to call it, we all know it plays some kind of role in determining the outcome of our favourite sporting contests. But just how important is it? That’s the question we will answer in this article for a rugby match between two evenly matched teams.
If we think about two evenly matched teams, we all intuitively understand that each team will win 50% of the time. We don’t need any sophisticated math to tell us this. It’s a simple coin flip.
Most of us also assume that a match between two perfectly evenly matched sides will be close. But is this true? How close is close?
It’s an important question to answer, simply because the careers of coaches and players hinge on wins and losses. A big loss, or series of losses, often sees coaches fired and players dropped. On the other hand, a big win or series of wins might be enough to earn a coach or player a new contract.
Once again, we can use Monte Carlo simulation to shed light on this situation. For those looking for a brief introduction to how we are using Monte Carlo methods in a sporting context, have a read of the first post where we considered how good a rugby team where the great Jonah Lomu occupied every position might be. But for now, we’ll get right to it and carry out 5000 full rugby match simulations between two evenly matched sides playing at the professional club level.
What do we expect the mean points differential (home team score minus away team score) between the sides to be?
In the absence of any home team advantage, which our simulations assume, the answer is zero. The points difference between two evenly matched sides should always average out to zero in the long term. The mean of our 5000 Monte Carlo simulations is just that, 0.0.
The standard deviation of the points differences of our simulations is 19.8. For those not familiar with statistics, the standard deviation simply tells us how much our data is spread out around the mean. The higher the value the more it is spread away from the mean. In the case of points difference, a higher standard deviation means more games are won and lost by large margins. A lower standard deviation means more games are won or lost in closely contested matches.
What would we expect the mean and standard deviation of a real rugby competition to be based on this result? Well, we would expect the mean to be a little more than 0 (we are talking from the perspective of the home team), since home town advantage is generally considered to be a real phenomenon. We would also expect the standard deviation to be a little more than 19.8, since in real professional competitions not all games are played by evenly matched teams. When two teams meet where one is a better than the other we would expect the points differential to be on average a little more, and therefore the spread in our data, as indicated by the standard deviation, to be a little more.
The mean of the points differential of games from the 135 round robin games played in the 2016 Super Rugby contest was 4.3 with a standard deviation of 21.9. As we hypothesised, the mean and standard deviation of the real world competition are a little larger than what our Monte Carlo simulations predict for two perfectly evenly matched teams. This comparison gives us some degree of confidence in the output of our simulations.
As a side note, the difference between the mean points difference of our simulations and that of the Super Rugby data is statistically significant, which suggests home team advantage is real and worth about 4 points per game. Note also, that the distribution of points differences is also approximately normal. This is quite a useful result, but not essential to what we are trying to do here so I have discussed this a little more at the end of the article.
Let’s get back to our main objective of determining how important chance is in determining the outcome of rugby games.
We are interested in the percentage of games that fall into any given score category. We can calculate this simply by counting up how many games fall into say the win by 1 to 10 points category (from the perspective of the home team in our case). These results are shown in the table below.
Probability of losing and winning a rugby match by various margins for two evenly matched teams.| Result | Probability (%) |
|---|---|
| Loss 30+ | 6.4 |
| Loss 21 to 30 | 8.8 |
| Loss 11 to 20 | 14.4 |
| Loss 1 to 10 | 19.1 |
| Draw | 3.0 |
| Win 1 to 10 | 19.0 |
| Win 11 to 20 | 14.1 |
| Win 21 to 30 | 8.7 |
| Win 30+ | 6.5 |
What struck me immediately is the first entry in the table, which shows we will lose around 6.4% of games by more than 30 points. So, against a team who is our equal, chance will have us get absolutely flogged about 1 in every 15 times we meet. A 30 point drubbing is the sort of result that has fans baying for blood, and starts to make coaches feel nervous. Especially when everyone was expecting a close game against an evenly matched opponent.
What about close games, how often will we actually get them? For the purposes of this discussion we’ll consider a close game to be a win or loss by 10 or less, or a draw. The table shows that this will happen about 19.1 + 3.0 + 19.0 = 41.1 % of the time. So rather than being the norm, a close result is actually in the minority of results.
The table also shows that a given team will suffer a relatively heavy loss by 11 or more points 14.4 + 8.8 + 6.4 = 29.6% of the time. For arguments sake, let’s assume that two such losses in a row would be enough for the clubs fans and administrators to start asking some serious questions about the quality of their coaching staff and players. Through chance alone, the probability of this happening in the next two games the team plays is about 8.8 % (0.296 x 0.296 x 100).
Let’s assume that after three such losses the club has had enough and they start looking at new coaching options for next season. Or perhaps one or two particular players happened to perform poorly in a couple of those matches, and the club starts looking to move them to another club. Through chance alone, the probability of this happening in the next three games the team plays is about 2.6 % (0.296 x 0.296 x 0.296 x 100).
What this tells us is that a team that does not understand probability, will be prone to making some terrible operational decisions. This in turn creates opportunities for those who do understand probability.
If one team can spot another team who has fallen into the above situation, and is looking to shed coaches and/or players when there are no other valid reasons to believe these coaches or players have suddenly become worse, then there will be an opportunity to recruit them to their own club which may not have otherwise existed. Even better, they will likely be available at a discount rate.
Of course, there will be times when there are problems at a sporting organisation. We can use an understanding of probability to help detect these too. As a simple example, the probability of suffering two losses by more than 30 points in a row for our evenly matched sides would be only 0.4 % (0.064 x 0.064 x 100). Because this is very low, if it were to happen in real life it would probably be worth investigating if there are any reasons that might have led to this. If it is indeed an outlier, we might be able to find another underlying event or circumstance that is also out of the ordinary that led to this. Perhaps one player had an exceptionally poor game, and on further investigation we find out that there was an underlying injury we were not aware of, or even or personal issue. Perhaps the player is aging and this is a trigger for us to start closely monitoring his typical performance profile to see if it is declining. The list goes on, but the point is an understanding of probability can be used to our advantage as an indicator of when to invest time digging deeper into events, and when to leave them be.
In summary, we have seen that the bounce of the ball in the form chance has a surprisingly large impact on the outcome of a rugby game, even when two teams are evenly matched. We’ve also seen that a team that understands this can exploit it to their advantage by recruiting coaches and players from other teams who have discarded them in error (and equally by not unfairly discarding coaches or players from their own side). They can also use an understanding of probability to try and detect when there may well be problems in their organisation.
That’s not the end of the story though. In part two of this article we will look at how teams can explore the same concept to try and avoid getting their training priorities wrong.
Some notes on normality
Earlier in this article it was stated that the distribution of points differentials of our Monte Carlo simulations turns out to be well approximated by a normal distribution. This can be seen in the nice bell shape in the histogram below.
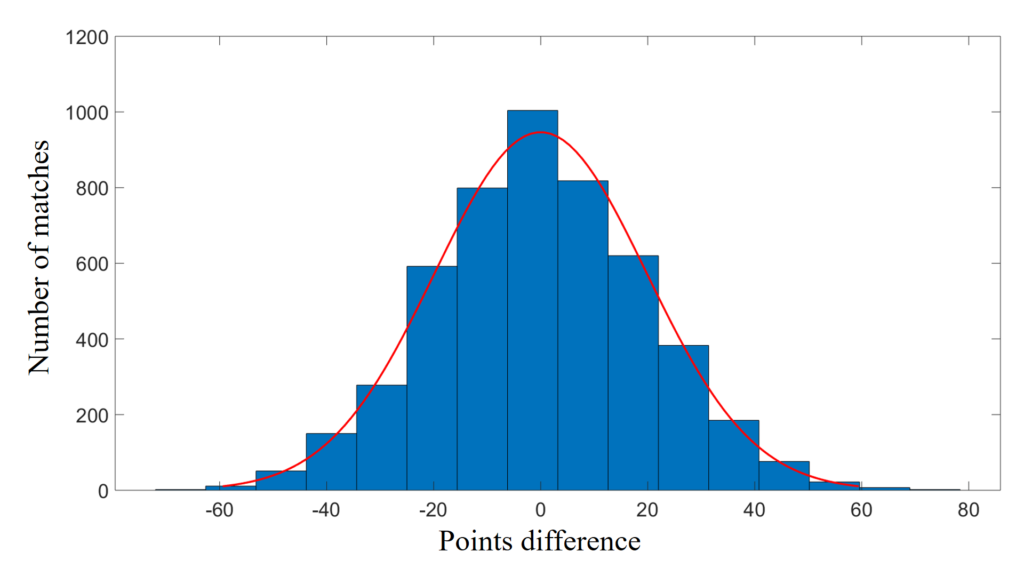
We shouldn’t always expect populations to be normally distributed. But when they are we can use standard normal distribution calculations to easily calculate any probability we are interested in. The table below compares the Monte Carlo calculated probabilities from earlier with those calculated under the approximation of a normal distribution. We can see that the two agree very closely.
Probability of losing and winning a rugby match by various margins for two evenly matched teams. As calculated from 5000 Monte Carlo simulations (column 1) and predicted from standard normal distribution calculations (column 2) using a mean of 0 and standard deviation of 19.8.
Result Probability (%) Probability (% predicted)
Loss 30+ 6.4 6.2
Loss 21 to 30 8.8 8.9
Loss 11 to 20 14.4 14.8
Loss 1 to 10 19.1 19.2
Draw 3.0 2.0
Win 1 to 10 19.0 19.2
Win 11 to 20 14.1 14.8
Win 21 to 30 8.7 8.9
Win 30+ 6.5 6.2
Being able to use standard normal distribution calculations not only gives us the ability to calculate any probability we are interested in easily, but has the advantage of being able to do so without having to iterate through or even have access to the simulation results. For example, if you know how to carry out such calculations you can verify that the probability of winning a game by 13 or more for two evenly matched sides is about 26 % and by 40 or more about 2 %.